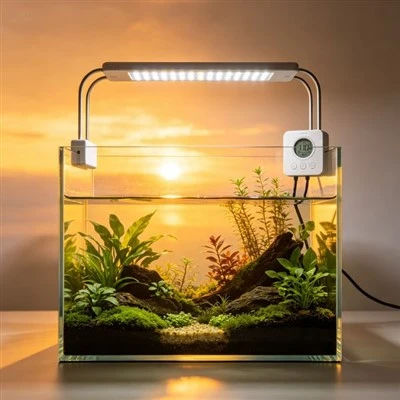
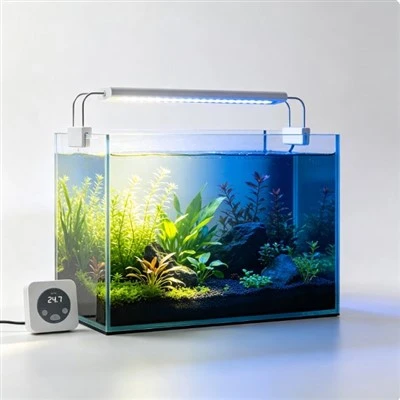
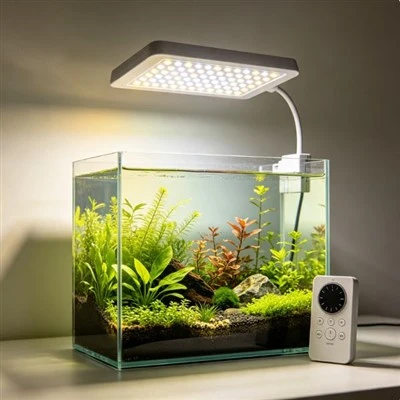
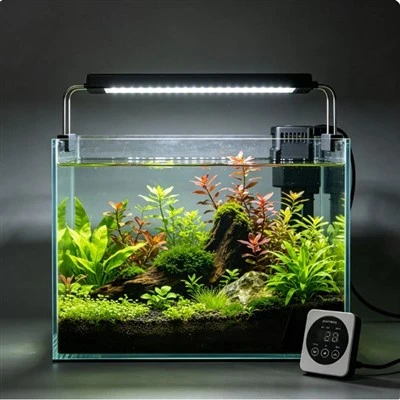
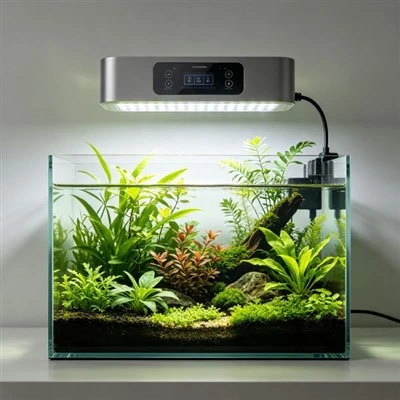
Place two aquarium lights above an empty table and they may illuminate it very differently even when their total output is similar. One makes a bright compact oval; the other spreads light broadly with softer edges. This is a question of angular distribution-how luminous intensity changes with direction. A goniophotometer measures that relationship by rotating the fixture, detector, or optical geometry according to its design. The resulting data can help engineers compare beam shape and model coverage, provided the test orientation and coordinate system are clearly connected to real installation.
The name describes the task: angles are varied while photometric quantities are measured. The instrument samples luminous intensity at defined angles in one or more measurement planes. Those points can be plotted as polar curves or assembled into a distribution file used by lighting software. Angular resolution determines how finely the pattern is sampled. A coarse step may overlook a narrow feature, while very fine angular sampling adds test time without compensating for poor alignment, an unstable source, or an inappropriate test distance.
Orientation is essential for aquarium fixtures because many are not rotationally symmetric. A round spotlight may be approximately similar through several vertical planes, although its mount or optics can still introduce asymmetry. A long bar commonly has one distribution across its width and another along its length. Publishing one attractive cross-section as if it describes all directions can mislead. Reports should name the longitudinal and transverse axes, fixture face, zero angle, rotation direction, and installed orientation.
Operating state requires equal precision. Record the model, sample, input supply, channel percentages, combined power limits, firmware where relevant, optical accessories, thermal condition, and stabilization criterion. A multichannel scene may have a different distribution from another if channels use different LED positions or optics. Fan behaviour and temperature can affect output during a long scan. A valid measurement plan keeps the light stable enough that angle, rather than warm-up drift, explains the changing detector signal.
Distance and alignment depend on the instrument and the size of the source. Photometric methods normally require geometry appropriate to the luminaire so the detector samples the intended angular field. Treating an extended bar as a mathematical point too close to the detector can distort interpretation. The laboratory should use a validated setup, align the reference centre and axes, account for stray light, and verify calibration. Owners should not try to recreate formal angular data by swinging a handheld lux meter around a powered pendant.
Turning angular intensity into an aquarium footprint introduces mounting height. At greater distance, rays at a given angle reach positions farther from the centre; at the same time, measured levels on a plane depend on geometry and the fixture's distribution. A polar curve can support calculation, but the real tank also has a water surface, glass, braces, lids, rock, plants, and reflections. Use the distribution to plan, then verify important zones after installation under documented conditions.
Consider a long fixture whose crosswise curve is wide but whose end-to-end pattern falls more quickly. Mounted over a short, wide tank, that may suit the target. Rotated ninety degrees or used over a longer aquarium, the same curve set leads to another result. The correct conclusion is not "wide beam" in the abstract. It is a distribution linked to named axes and geometry. Clear mounting coordinates help a designer place multiple units without pretending that their overlapping beams remain unchanged by structure.
Angular photometry is also useful for glare and spill analysis. High-angle intensity may reach a seated viewer outside the tank even while central illumination looks good. A louver, reflector, or baffle can change that region, but it may also darken an edge. Testing the actual approved accessory produces more reliable data than digitally trimming a curve. If several configurations are offered, each distribution file should identify its optic and mounting state so customers do not apply the bare-fixture result to a shielded product.
The polar plot is not a husbandry prescription. It does not show underwater PPFD by itself, account for every spectral channel, or demonstrate that a coral or plant will thrive. Total flux, spectrum, angular distribution, mapped irradiance, water conditions, and biological requirements answer different questions. Marketing should avoid drawing a tank silhouette around one curve and calling it guaranteed coverage. A useful engineering report provides the data and limitations needed to create a testable installation plan.
Goniophotometry makes direction measurable. Its credibility comes from stable operation, defined axes, sufficient angular sampling, suitable geometry, calibrated equipment, and an exact fixture configuration. The resulting map explains why equal totals can create unequal footprints and why a bar needs more than one cross-section. Used honestly, it guides mounting, glare control, and comparison. Used without coordinates or tank verification, the plot cannot be interpreted reliably. The difference is a method that tells readers precisely where the light was sent.
Distribution files can support simulation only when their metadata survives. The file should retain the photometric centre, coordinate convention, symmetry assumption, tested power, dimensions, and orientation. Importing data with the wrong axis or scale can create a convincing but inverted layout. Engineers should compare a simulated reference plane with a physical measurement under matched geometry before trusting a large installation model. Differences can expose coordinate mistakes, overlooked obstructions, or limits in how water and reflective tank surfaces were represented. Simulation then becomes a planning tool bounded by validation, not a substitute for checking the actual aquarium after the fixture, lid, and hardscape are in place.
Stray-light control should be verified rather than assumed. Room light, reflections from supports, detector dark signal, and light leaking through a mount can alter low-intensity angles. A dark measurement and reference checks help characterize the system. These details matter especially near the edges of a beam, where a small unwanted signal can look like genuine wide distribution.