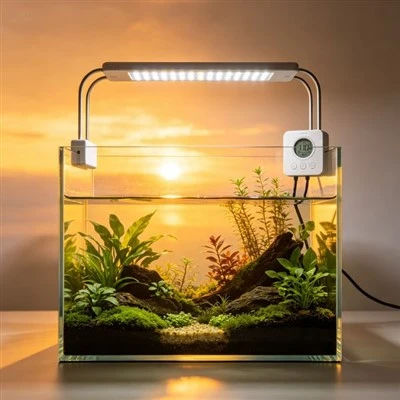
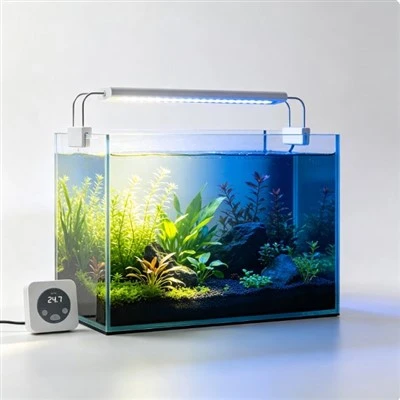
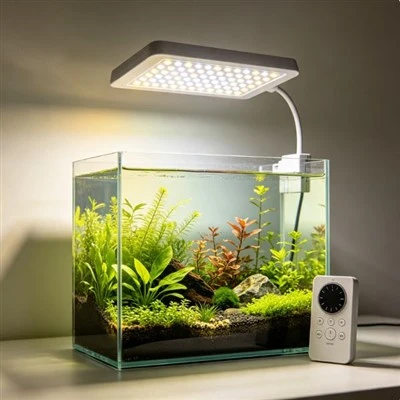
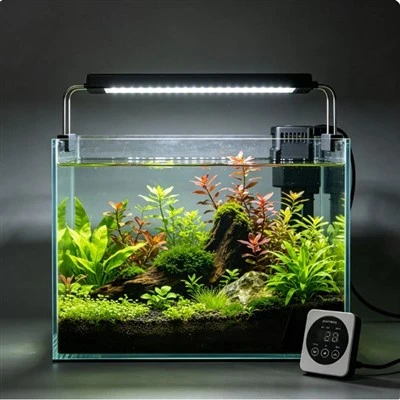
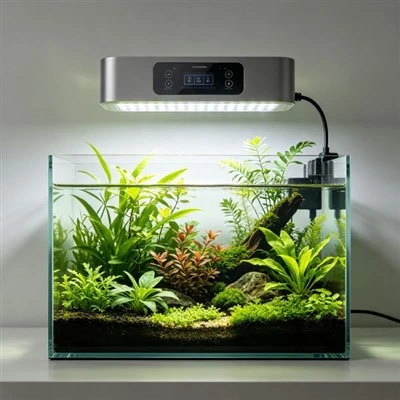
The test begins with a result that looks impressive and suspicious at the same time. A technician holds a photon meter close to an aquarium light, raises the fixture from 70 percent to 85 percent, and then to 100 percent, yet the display shows exactly the same top value each time. It is tempting to conclude that the lamp has stopped responding. Another tempting conclusion is that the repeated number proves the fixture has reached a remarkable output. Neither conclusion is justified until the measuring system itself has been checked. A meter can only report signals that fall inside the range its sensor and electronics are designed to handle.
Every photon meter has limits. Depending on its design, it may show an overload symbol, freeze at its highest displayable number, automatically change range, or continue presenting a value that no longer rises with the incoming signal. This behaviour is commonly called clipping or saturation. Once it occurs, the reading describes the ceiling of the instrument or selected range, not the actual PPFD at the sensor plane. Two very different light levels can therefore produce the same displayed number. Treating that ceiling as a valid maximum hides information rather than creating it.
A familiar analogy is a kitchen scale that can weigh no more than five kilograms. If a six-kilogram container and an eight-kilogram container both make the display stop at five, the scale has not shown that the containers weigh the same. Moving an optical sensor too close to a concentrated LED source can create a similar problem. The analogy is useful, but optical measurement adds more variables: sensor orientation, spectrum, diffuser response, distance, fixture setting, and the exact range or mode selected on the meter can all affect the result.
The first practical step is to identify the complete measuring system. Record the sensor and meter model, the stated range, the calibration status, and the way an overload is indicated. Read the actual instrument instructions instead of assuming that every meter behaves alike. Some systems use separate sensors or selectable ranges; others do not. Confirm that the units on the display are the units required for the comparison. A number without the meter identity, range, and unit cannot be meaningfully compared with a number from another test bench or another supplier.
Geometry must then be made valid and repeatable. If the instructions permit a greater distance or a different range, move the sensor to a documented position where it is not overloaded. Keep the sensing surface oriented as required, define the point relative to the fixture, and make sure neither the operator nor a nearby reflective object changes the light reaching it. Do not merely tilt the sensor until the number falls; that creates a different measurement of angular response. The goal is not to obtain a convenient value but to place the instrument in a condition where its response is known to be usable.
Repeat the output sequence only after the geometry and range are controlled. Record each fixture setting, allow any stabilization required by the method, and note the corresponding reading as well as any warning or range change. A valid series should be evaluated as a series, not by keeping only the largest result. If a lower and higher setting still read alike within the meter's usable range, that observation may justify further investigation of the controller or fixture. Saturation must first be ruled out, because no calculation can reconstruct the missing signal from a clipped reading without a separately validated method.
Spectrum also deserves attention. A quantum sensor estimates incident photosynthetic photon flux density over its specified wavelength range, but real sensors do not have perfectly flat spectral response. Calibration, spectral mismatch, and the composition of the LED channels can influence uncertainty, particularly when comparing very different spectra. This does not mean a home user needs to become a metrology laboratory. It means that a report should state the spectrum or operating program used and should avoid implying that one close-range reading represents every colour mix, depth, or point across an aquarium.
Safety boundaries remain simple. The test should not require opening the fixture, bypassing protection, defeating a seal, or probing live circuits. Do not place a meter, cable, or person where it can fall into the aquarium, and do not exceed the approved mounting or operating arrangement merely to reach a desired number. If the light, supply, or connector is wet, damaged, smoking, unusually hot, or producing a burning smell, stop the test and isolate it only when that can be done safely. Measurement does not take priority over electrical safety.
A credible report makes the limitation visible. It identifies the fixture and revision, operating setting, spectrum, sensor and meter, calibration status, stated range, overload behaviour, distance, orientation, environmental conditions, and all recorded values. It labels an overloaded result as overloaded rather than converting it into a maximum claim. This level of detail is not paperwork for its own sake. It lets another person reproduce the valid part of the test and understand why the clipped part cannot support a conclusion. The most useful number is not the biggest one on the screen; it is the one obtained inside a method that can actually measure it.
Range changes and optical attenuation require the same discipline. If the instrument offers several ranges, record the one used and confirm that switching ranges does not change geometry. If its manufacturer provides a characterized attenuator or accessory for high signals, apply the documented correction exactly; an improvised tinted sheet is not equivalent because its transmission can vary with wavelength and angle. It may be more useful to measure a reproducible plane farther from the fixture and report that geometry than to chase a close-up maximum. The measurement question should also be stated: commissioning a tank, comparing control steps, and characterizing a product can require different grids and uncertainty. In every case, keep raw overload indications rather than deleting them, because they show where the method stopped producing valid quantitative data.